
Power BI Workshop Builds Data Analysis Skills at KWC
Report on Power BI Workshop
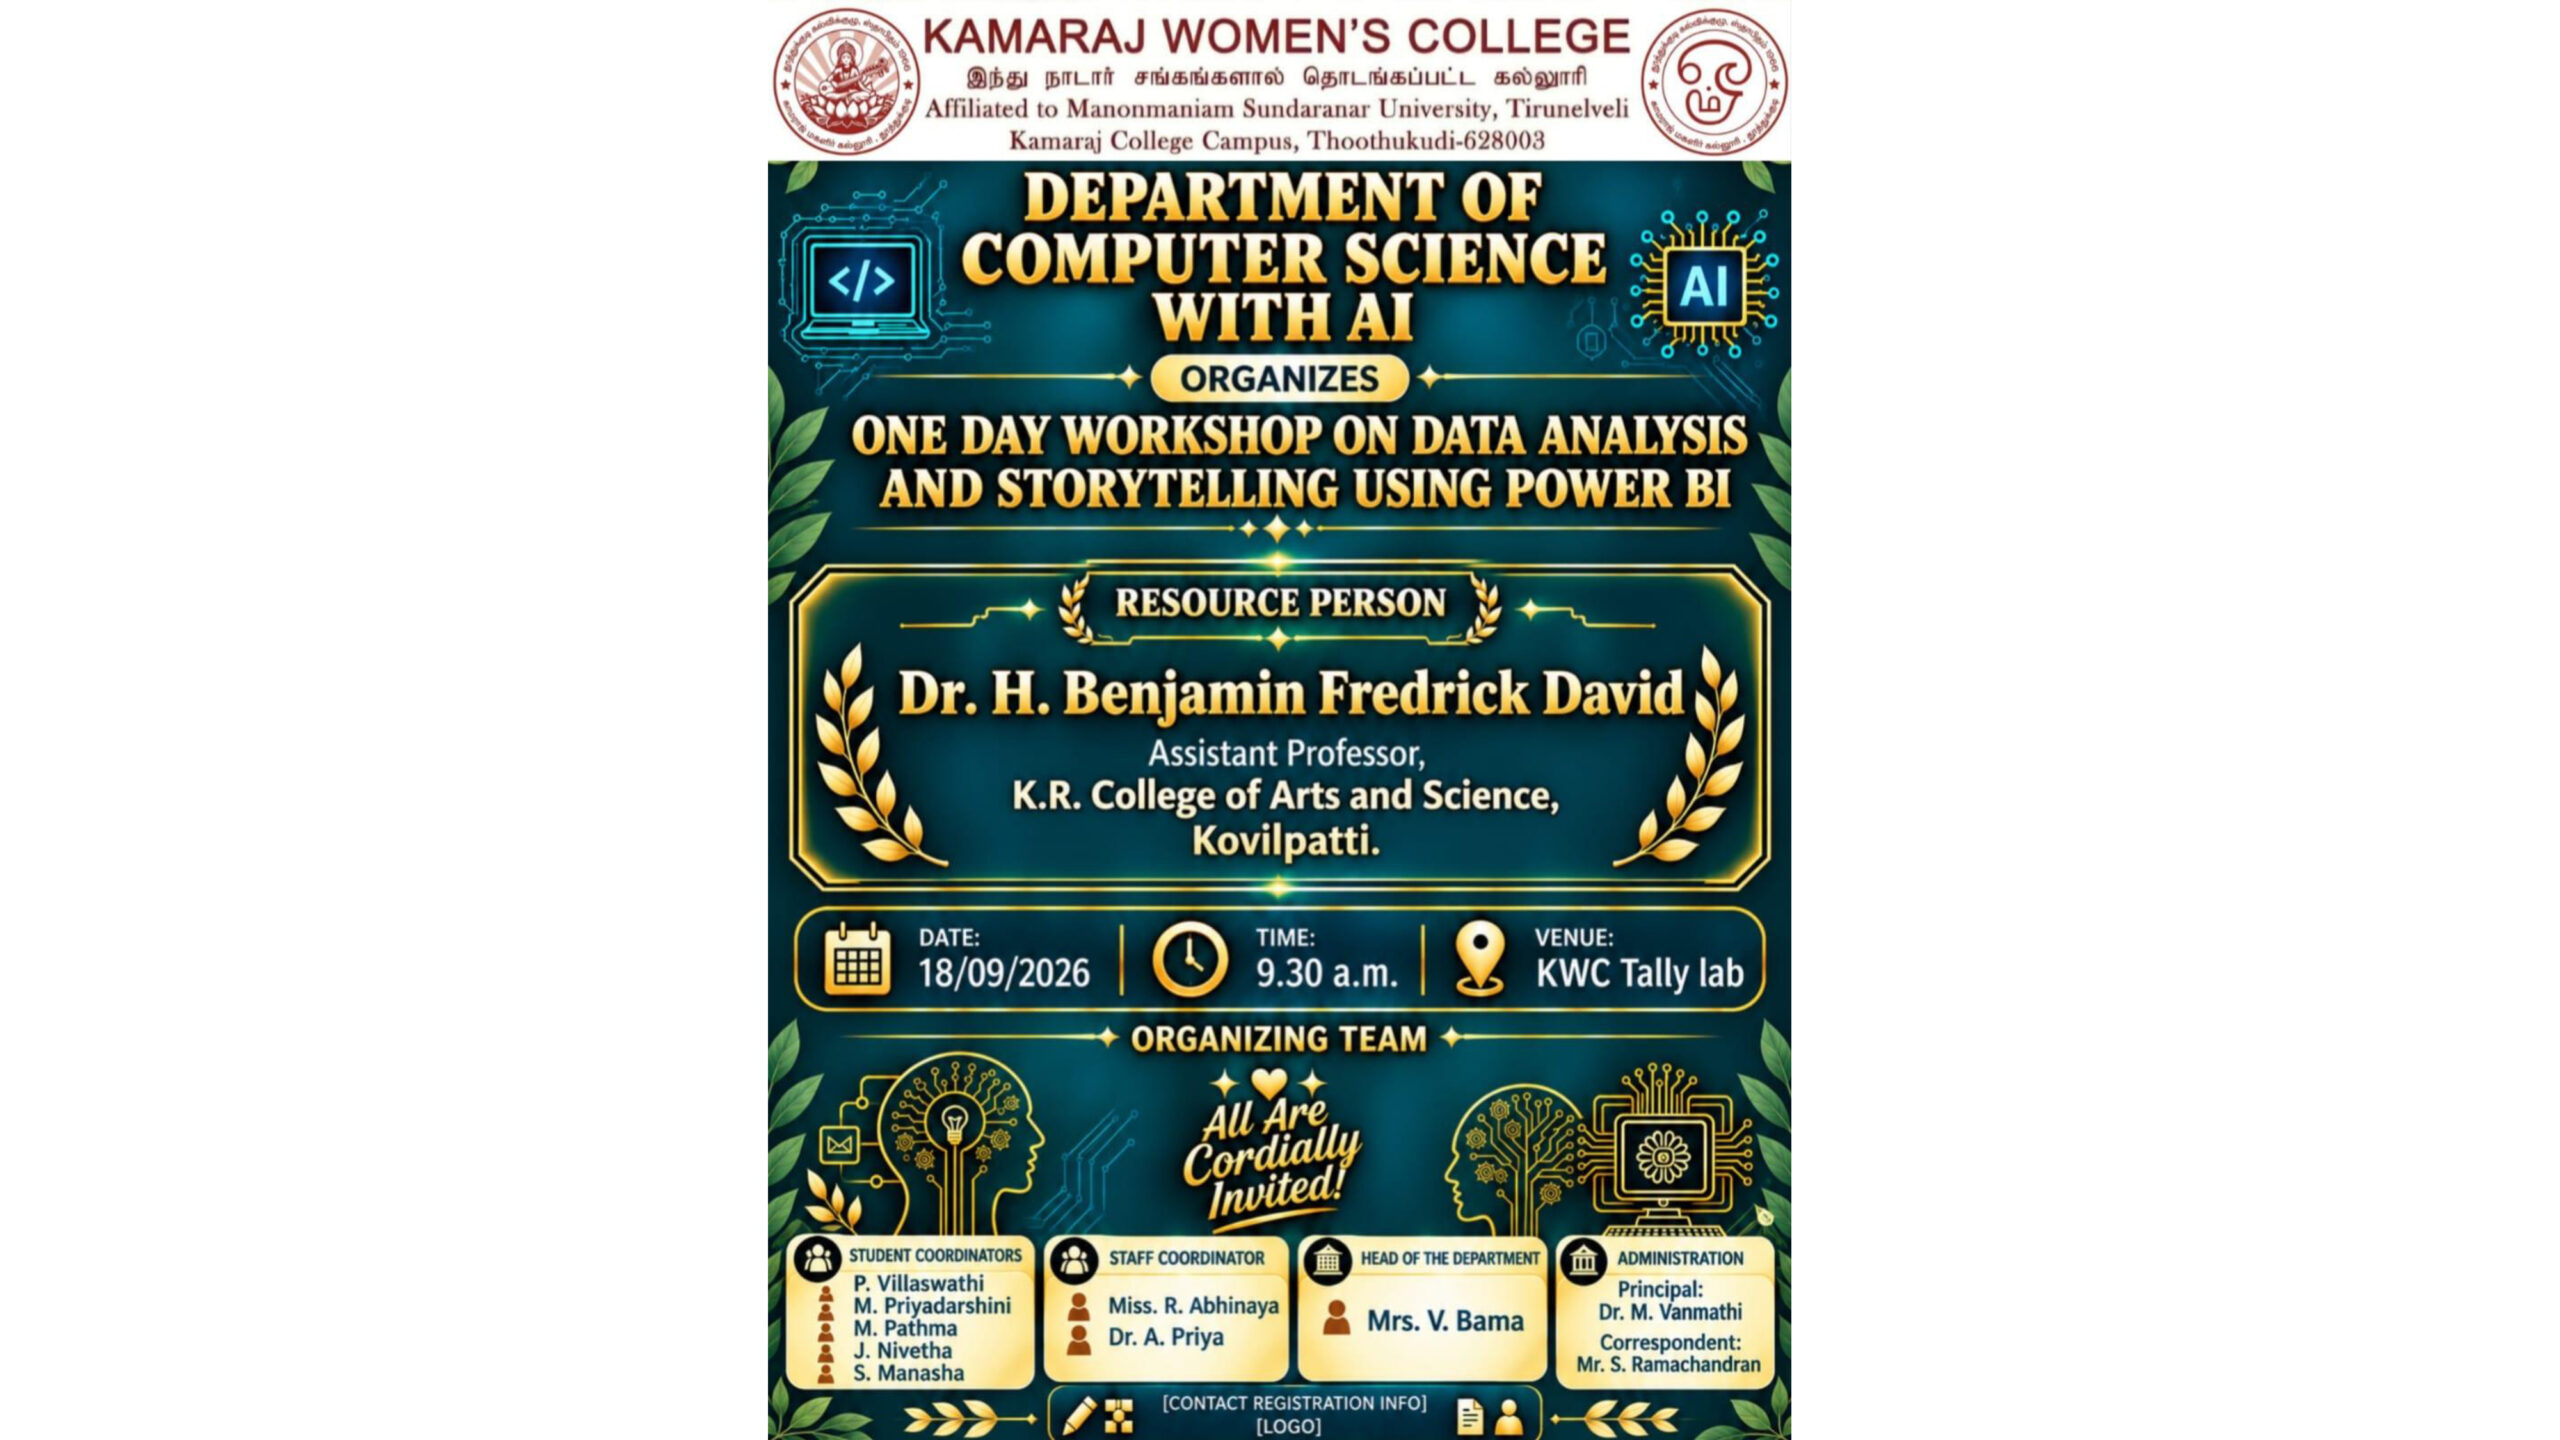
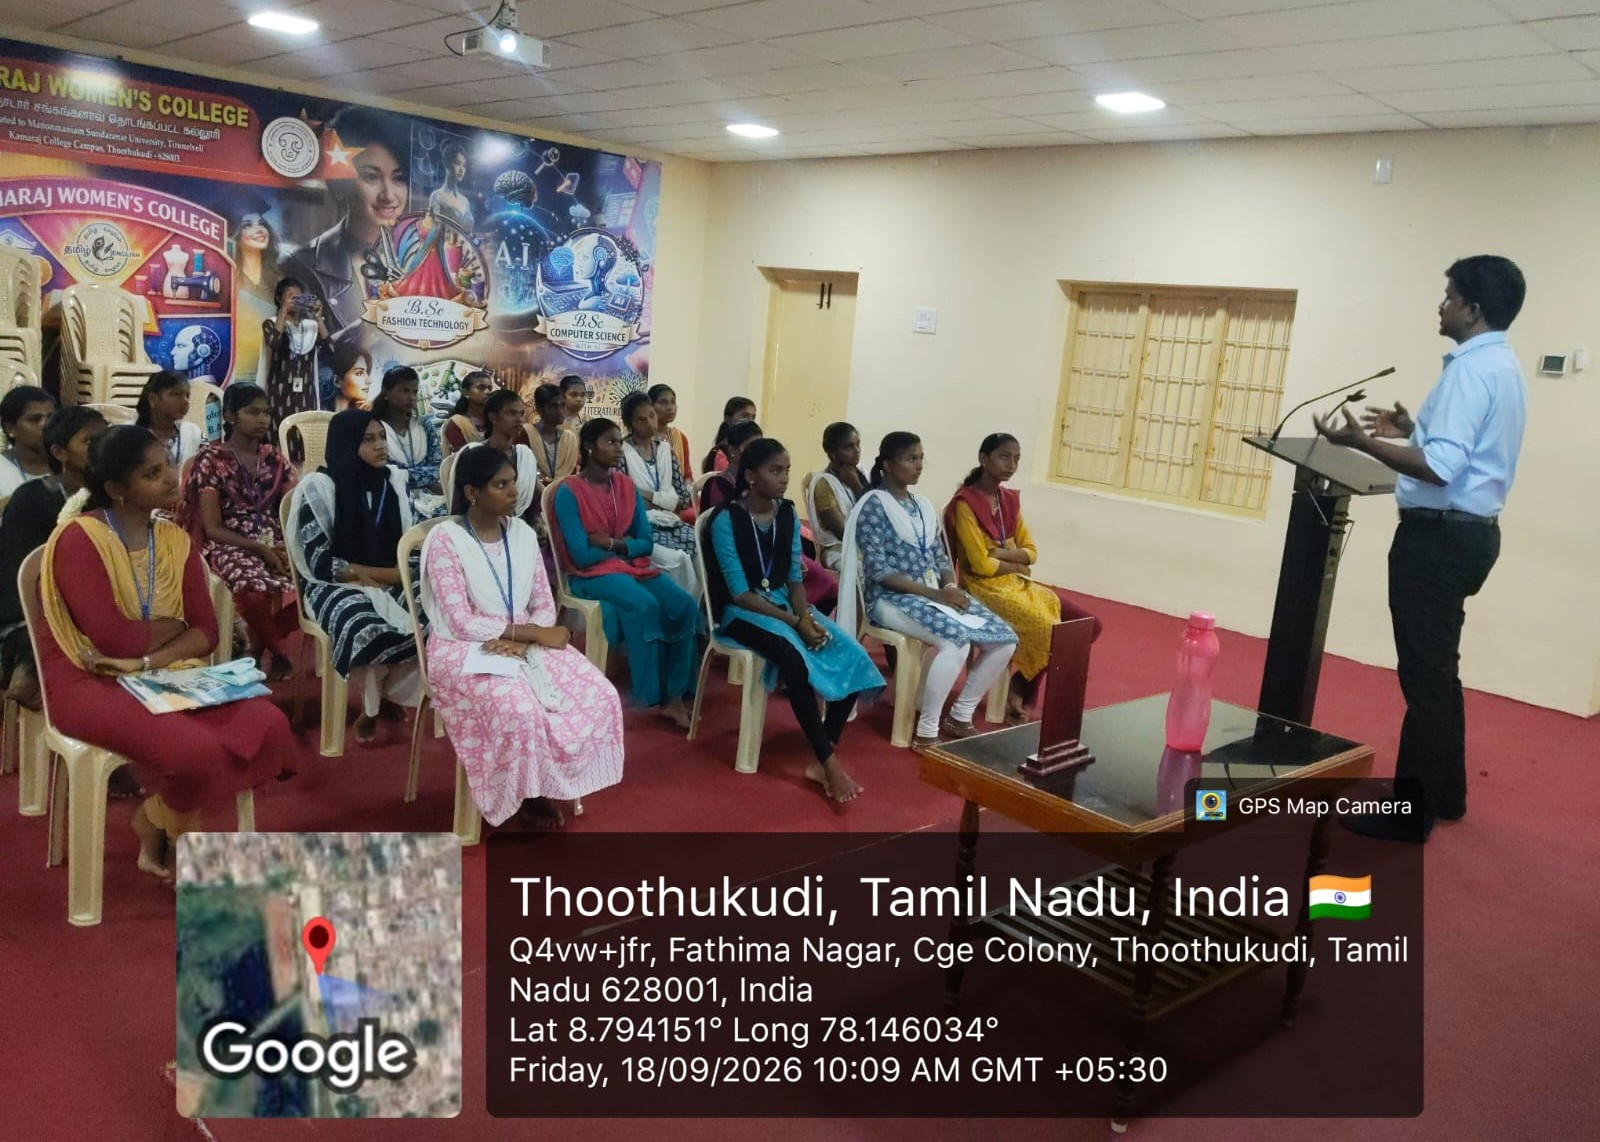
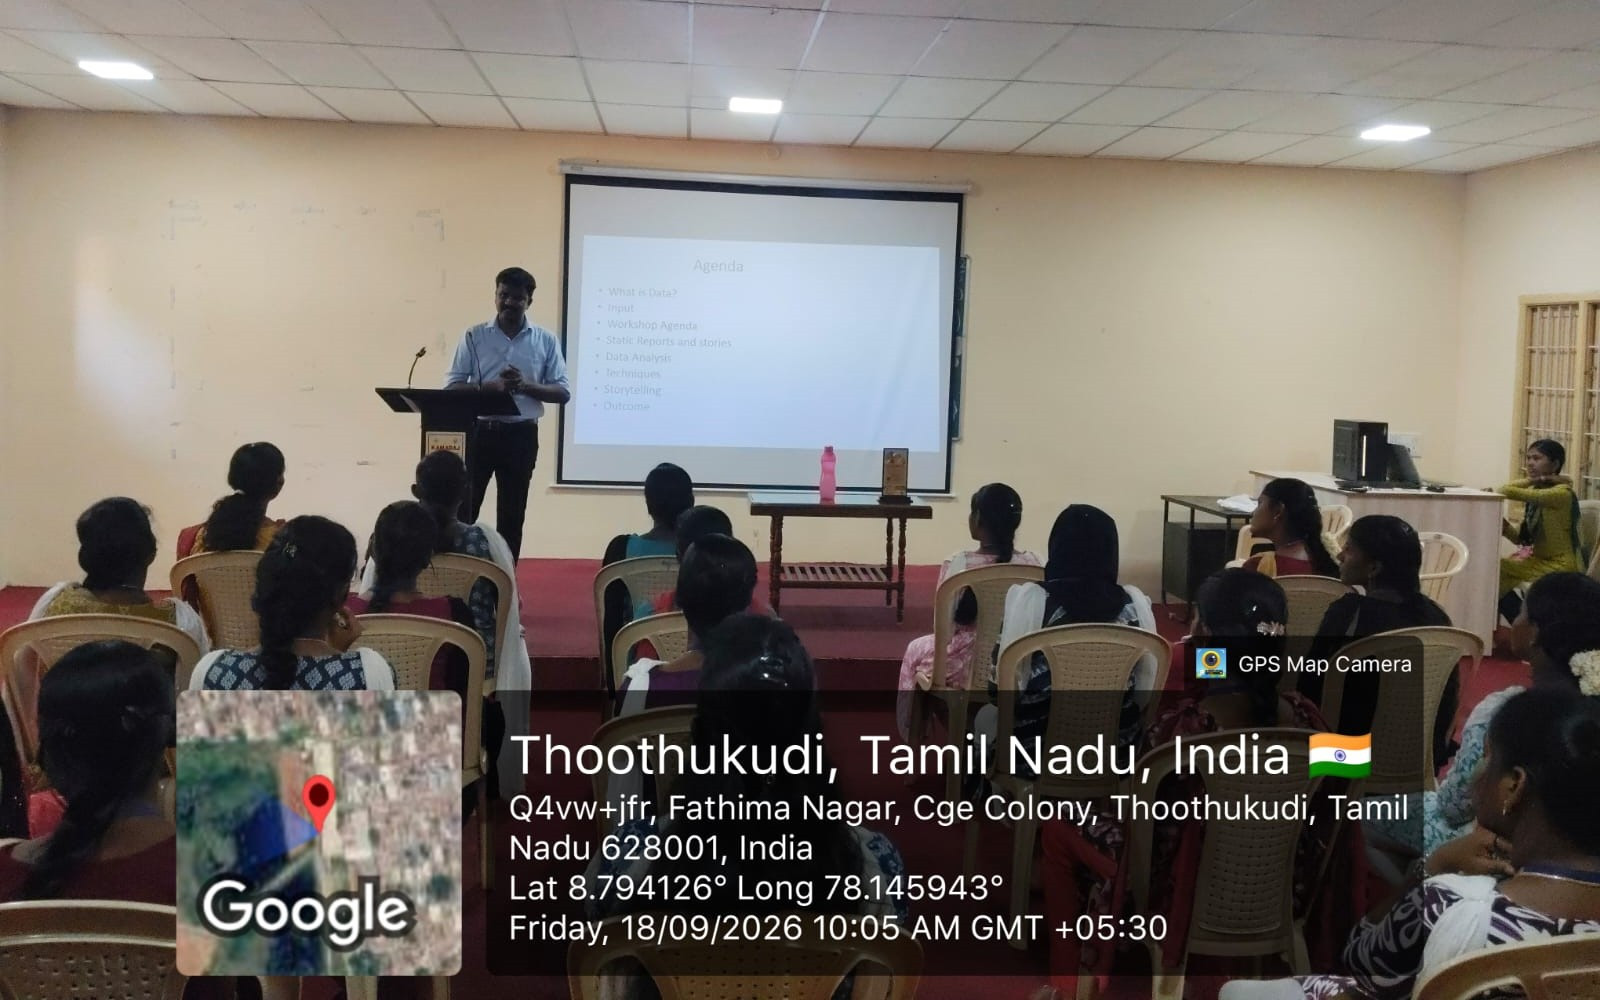
The Department of Computer Science with Artificial Intelligence, Kamaraj Women’s College, Thoothukudi, organized a one-day Power BI Workshop on “Data Analysis and Storytelling Using Power BI” on 18 September 2026 at 9.30 a.m. in the KWC Tally Lab.
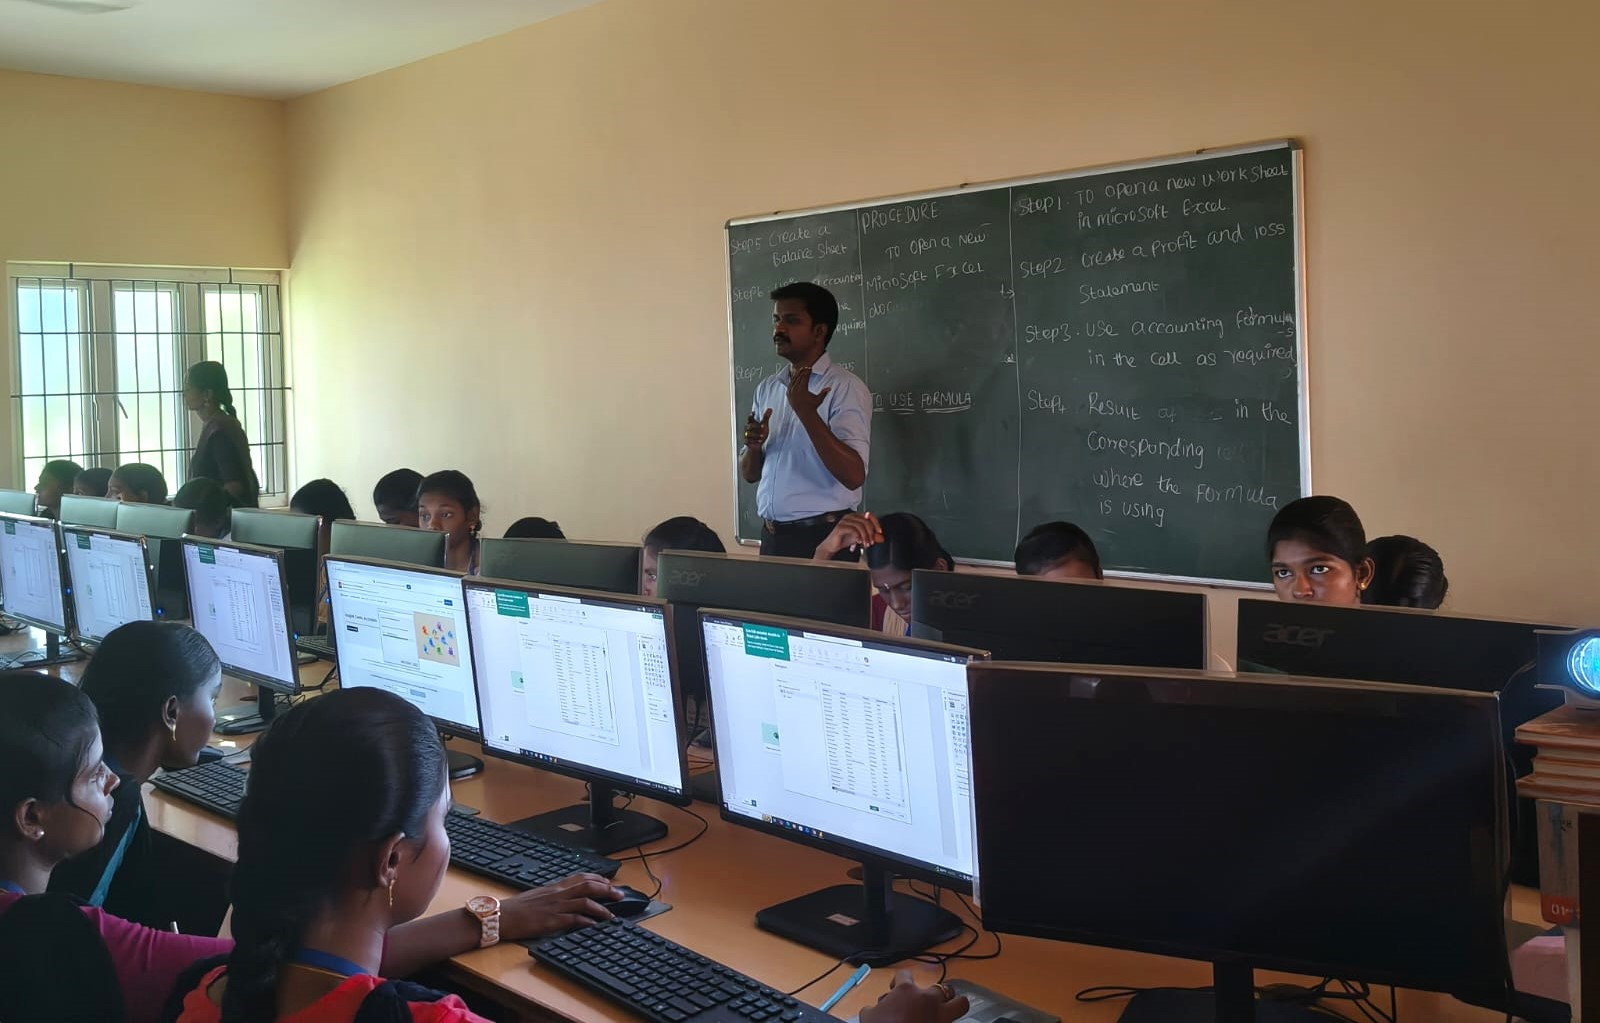
The workshop focused on data analysis, data visualization and data storytelling using Microsoft Power BI. It gave students practical exposure to transforming raw data into meaningful charts, reports and interactive dashboards. Moreover, the session helped students understand how data can be presented clearly and effectively.
Objectives of the Power BI Workshop
The workshop focused on the following objectives:
- Introduce students to Microsoft Power BI
- Develop basic data analysis skills
- Introduce students to data visualization techniques
- Explain the concept of data storytelling
- Demonstrate how raw data can be transformed into useful information
- Help students understand charts, reports and dashboards
- Provide practical exposure to modern data-analysis tools
- Connect technical learning with real-world applications
- Improve students’ ability to present data clearly
Thus, the workshop combined technical knowledge, practical learning and visual communication.
Inaugural Session
The programme began with a prayer song, which marked the formal start of the workshop.
J. Subitha served as the Master of Ceremonies and coordinated the proceedings.
Following this, D. Janani delivered the Welcome Address and welcomed the gathering.
M. Pathma then introduced the Resource Person to the participants. The introductory session prepared the students for the technical and practical learning that followed.
Introduction to Microsoft Power BI
The Power BI Workshop introduced students to the fundamental concepts of Microsoft Power BI.
The Resource Person explained how Power BI can support data analysis and help users understand information through visual presentation.
Moreover, the session showed students how data-analysis tools can turn large amounts of raw information into a more understandable form.
This introduction gave students a foundation for understanding the practical applications of Power BI.
Understanding Data Analysis
Data analysis formed a major part of the workshop.
The Resource Person explained how users can examine raw data and transform it into meaningful information. In addition, students learned how proper analysis can make data easier to understand and interpret.
The session helped students see data as more than a collection of numbers or values. Instead, they learned how analysis can help identify useful information within a dataset.
Therefore, the workshop strengthened their understanding of the role of data analysis in modern applications.
Data Visualization Using Power BI
The workshop gave special attention to data visualization.
The Resource Person demonstrated how Power BI can transform data into charts, reports and visual representations. These visual formats can help users understand information more quickly and clearly.
Moreover, students learned the importance of selecting suitable ways to present data.
The session demonstrated how effective visualization can make complex information easier to understand.
Creating Reports and Interactive Dashboards
Students also gained exposure to the creation of reports and interactive dashboards using Power BI.
The Resource Person demonstrated how raw data could be organized and displayed through meaningful visual elements.
Furthermore, the session helped students understand how dashboards can bring different pieces of information together in an organized format.
As a result, students gained practical knowledge about presenting analysed data in a visually appealing and easy-to-understand manner.
Data Storytelling
Another important part of the programme was data storytelling.
The workshop helped students understand that presenting data involves more than creating charts. The information should also communicate a clear and meaningful message.
Therefore, students learned how effective visualization and proper presentation can help explain the meaning behind data.
Moreover, the concept of data storytelling encouraged them to think about how information can be communicated clearly to different audiences.
Practical Exposure to Modern Data Tools
The workshop provided students with valuable exposure to a modern data-analysis tool.
Through the demonstration of Microsoft Power BI, students could understand how technical concepts connect with practical applications.
Furthermore, the session introduced them to ways of organizing, analysing and presenting information.
This practical exposure complemented their classroom learning and strengthened their understanding of data-related technologies.
Real-World Applications
The programme also helped students understand the relevance of data analysis in real-world contexts.
Data plays an important role in many fields, and tools such as Power BI help users analyse and present information effectively.
Therefore, exposure to Power BI gave students a broader understanding of how data-analysis skills can support practical tasks and professional applications.
In addition, the workshop encouraged students to develop greater interest in modern tools connected with data and technology.
Guidance and Coordination
The Department of Computer Science with Artificial Intelligence conducted the workshop under the guidance of Mrs. V. Bama, Head of the Department.
Faculty members and student coordinators extended their support for the smooth conduct of the programme.
Moreover, the involvement of students in the inaugural proceedings added to the overall coordination of the workshop.
The combined efforts of the department, faculty members and student coordinators contributed to the successful conduct of the programme.
Learning Beyond the Classroom
The Power BI Workshop created an opportunity for students to learn beyond their regular classroom sessions.
The workshop connected concepts related to data analysis, visualization and presentation with a widely used data-analysis platform.
Moreover, students gained practical exposure to the process of transforming data into useful visual information.
Thus, the programme strengthened both technical understanding and practical learning.
Programme Outcomes
The Power BI Workshop provided several useful learning outcomes:
- Students gained an introduction to Microsoft Power BI
- They developed a better understanding of data analysis
- Students learned the importance of data visualization
- The workshop introduced the concept of data storytelling
- Students learned how raw data can become meaningful information
- They gained exposure to charts and reports
- Students understood the purpose of interactive dashboards
- The workshop provided practical exposure to a modern data-analysis tool
- Students improved their understanding of real-world applications of data analysis
- The programme connected classroom knowledge with practical technology
As a result, the programme strengthened students’ knowledge of data analysis, visualization, dashboards and data storytelling.
Conclusion of the Power BI Workshop
The Power BI Workshop organized by the Department of Computer Science with Artificial Intelligence, Kamaraj Women’s College, provided students with an informative and practical learning experience.
The workshop introduced students to Microsoft Power BI and demonstrated how raw data can be transformed into meaningful charts, reports and interactive dashboards. Moreover, the session helped students understand the importance of data visualization and storytelling in presenting information effectively.
The guidance of Mrs. V. Bama, Head of the Department, along with the support of faculty members and student coordinators, contributed to the programme.
Overall, the workshop successfully enhanced students’ understanding of modern data-analysis tools and their real-world applications while providing valuable practical exposure beyond the classroom.